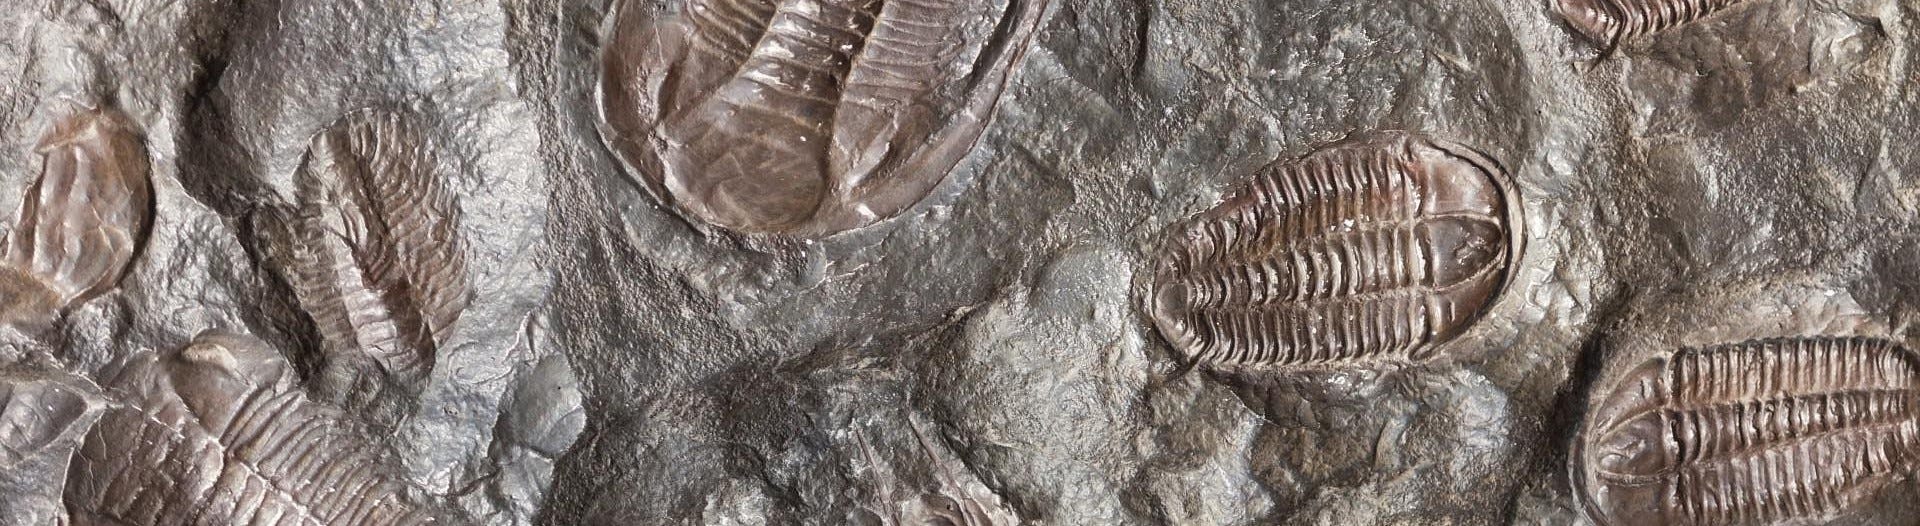
Today, I visited a natural history museum and headed directly for an exhibition about the evolution of the Earth. The museum explained how the Earth was formed and how the continents moved over millions of years. They painted a vivid picture of what happened over an almost unimaginable period of time.
Then I came to a section with thousands of different rocks. I looked at a few of them and moved on. I have to admit, the rocks didn’t fascinate me nearly as much as the section before.
Halfway through, I stopped and started reading the displays more carefully. It took some effort to get through a few of the longer texts. But gradually, I started to understand what I was actually looking at.
Each rock had a different history. Some had formed deep in the ocean and had later been brought to the surface through continental drift. Others were the result of volcanic activity.
Before, these were just rocks. After reading a few of the displays, I saw them differently. Geological processes that took millions of years. Continents moving. Oceans disappearing. Organisms evolving. Entire ecosystems appearing and vanishing.
I couldn’t help myself. I started thinking about… business. Which sounds like a rather disappointing way to spend a morning in a natural history museum. But there was something about the way the museum told the story that made me think about how we understand much more ordinary things.
The story beneath the artefacts
We tend to think we understand things simply because we’ve seen them a thousand times. Seeing something is not the same as understanding what produced it. We see the finished product, the price, the sales number, the profit. We recognize all of these things, so we rarely stop to ask what produced them. But a financial number is a little bit like that rock. It is the visible result of something much bigger happening underneath.
Revenue is customers making choices. Costs are decisions about how a business operates. Margins tell us something about pricing, competition and efficiency.
The numbers are the artefacts. The business is the story connecting them.
Moving from artefacts to stories
When reading about a company, it sometimes happens that I just read the numbers without thinking a lot about them. Revenue grew 12%. Gross margin fell 4 percentage points. Inventory increased 25%. Headcount increased 15%.
Aha. It is a bit like walking past all those interesting rocks, but not realizing that they tell a story. So, how could these numbers fit together?
If revenues are up, but at the same time the margin declined, one explanation could be that the company cut prices. Since the product was cheaper, people bought more, but the price cut hurt the margin. Perhaps the company also built inventory in anticipation of further growth. And it may have hired new employees ahead of demand.
If this story is true, it seems the company is sacrificing some profitability today to pursue growth tomorrow.
That is not to say that the story is always right. The story can still be wrong. The same four numbers could tell several different stories. Revenue might have increased because of price increases. The margin may have declined because the company sold more of less profitable products. Just to name a few.
A revenue number is easy to understand as a number. It’s more difficult to understand what caused it. A rock is easy to understand as an object, too. What’s difficult, and interesting, is understanding how it came to be there.
Looking Beneath the Surface
So financial literacy isn’t about being able to look at four numbers and magically know the answer. It’s about knowing what questions to ask and trying to understand what lies behind the numbers.
As I continued through the museum, I’m sure I still walked past plenty of things without giving them much thought. I suspect the same will happen with financial numbers. I will still look at a number sometimes and move on. But perhaps the useful habit is simply to pause occasionally and ask:
What am I actually looking at?